Overview
TriplotGUI is an innovative tool designed to address the challenges of analyzing and interpreting complex relationships between exposures, Omics data, and health outcomes in large-scale epidemiological studies. Here’s an overview of its key features and capabilities:
Background&aim: Exposure- and outcome-wide studies aim to identify potential risk factors and their health effects on a broader scale. While Omics technologies have enabled linking exposome to outcomes, there’s often a lack of large-scale exploration of mediating mechanisms. This gap exists due to the high-dimensional nature of Omics data and the absence of effective tools for interpreting complex relationships. TriplotGUI was developed to advance exposure-risk assessment and facilitate the interpretation of these complex associations via omics profiles.
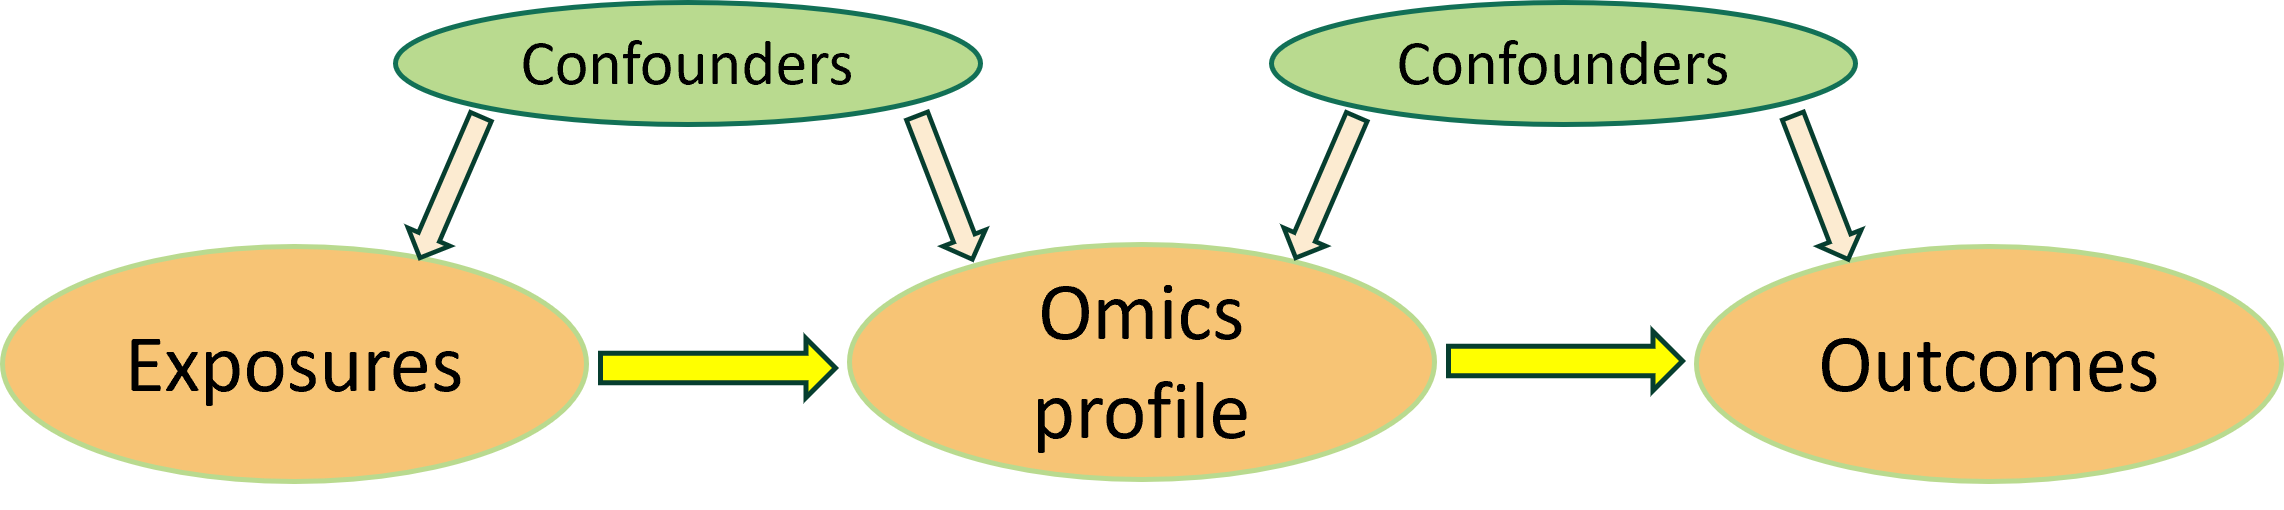
Methods: TriplotGUI employs several key analytical approaches. First, Omics variables are reduced to components using methods such as Principal Component Analysis (PCA) or Weighted Correlation Network Analysis (WGCNA). These components are then associated with both exposures and outcomes through linear models. To investigate potential mediators, TriplotGUI utilizes a “meet-in-the-middle” analysis that intersects exposure-Omics and Omics-outcome associations, along with mediation analysis. The tool supports both classical (Baron-Kenny) mediation and counterfactual mediation, while also allowing for adjustment for covariates. A casual diagram that summarize TriplotGUI’s assumption is shown below,
Results: Among its various functionalities, TriplotGUI co-visualizes Omics variable contributions, exposure-Omics associations, omics-outcome associations, and provide visual ourput for direct and indirect effects from mediation analysis. By centering analyses around molecular data, TriplotGUI enables the simultaneous assessment of multiple exposures and outcomes. Users can conveniently perform analyses and visualizations through a web-based version of TriplotGUI or install it as a stand-alone application in RStudio, making it suitable for secure environments in compliance with GDPR. Please read the Setup session for more about installation.
TriplotGUI has been tested using both synthetic and real-world data, particularly focusing on dietary variables as exposures. The tool has demonstrated its capability to comprehensively analyze, visualize, and interpret associations between exposures and outcomes through metabolomic profiles.
Conclusion: In summary, TriplotGUI offers a powerful and flexible platform for integrating exposures, omics data, and outcomes to unravel their complex relationships. Its user-friendly interface combined with comprehensive analytical capabilities makes it an invaluable tool for molecular epidemiology research, advancing our understanding of exposure-risk relationships and potential mediating mechanisms
Steps
TriplotGUI is a reactive stepwise modular application designed for multi-omics data analysis. The workflow consists of five key steps and two general functionalities, with each step building upon the previous ones. Here’s an overview of the process:
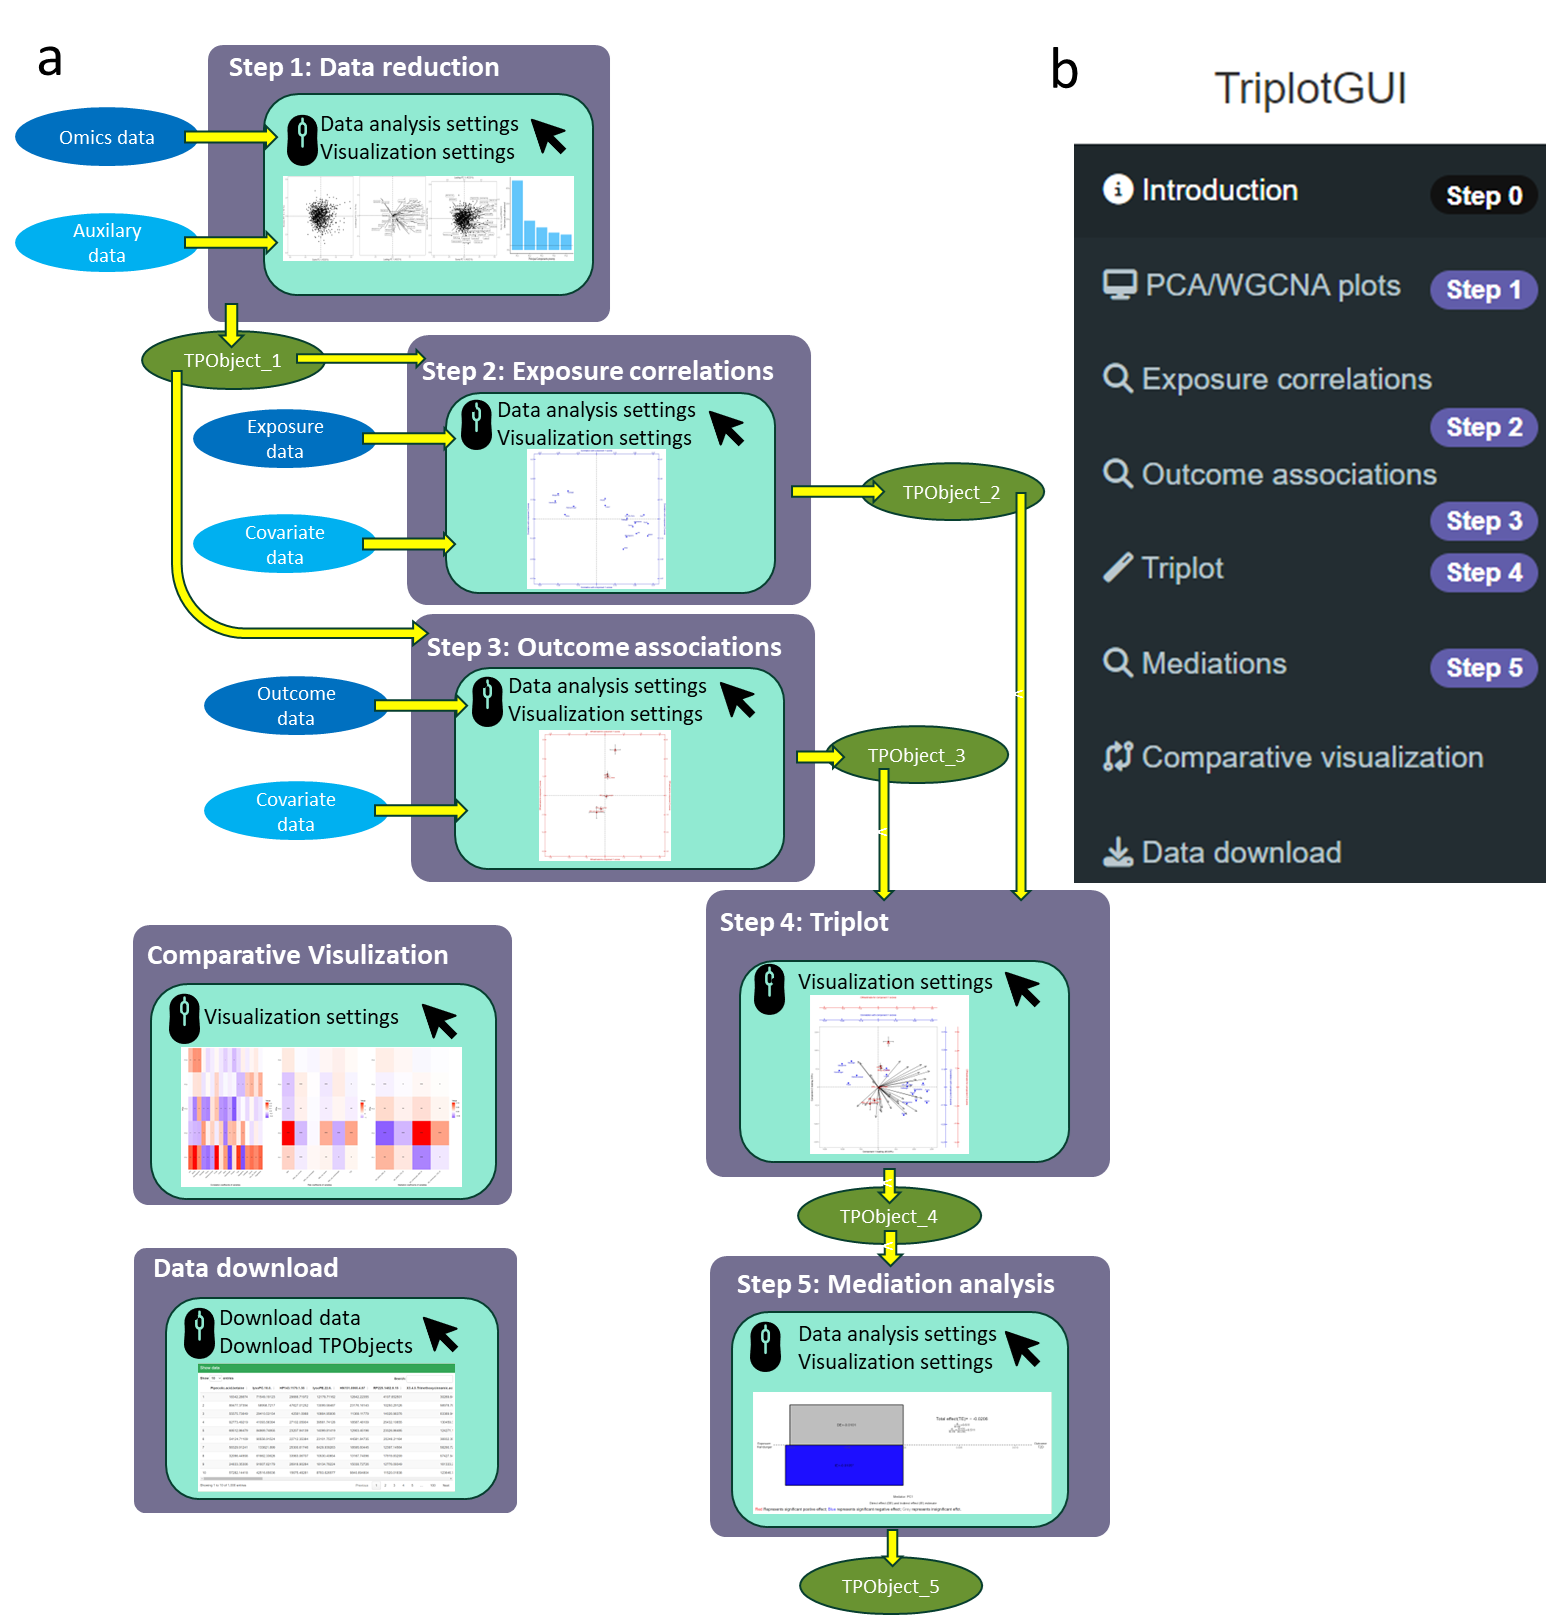
Step1: Data reduction of Omics variables
Transforms high-dimensional Omics data into a manageable number of components using principal component analysis (PCA) or weighted correlation network analysis (WGCNA).
Step2: Associations with exposures
Assesses associations between exposures and component scores from Step 1, with the option to adjust for confounders.
Step3: Associations with outcomes
Evaluates risk associations between outcomes and component scores from Step 1, allowing for confounder adjustment.
Step4: Meet-in-the-middle Triplot Visualization
Co-visualizes three layers of information in a 2D plot:
- Component scores and loadings
- Correlation coefficients
- Risk association estimates (beta coefficients or odds ratios)
Step5: Mediation analysis and visualization
Performs mediation analysis on selected exposures and outcomes, using component/module scores or individual Omics variables as mediators.
Provides mediation barplots showing the magnitude and direction of indirect, direct, and total effects for individual mediation analyses.
Comparative Visualization:
Compares exposure-Omics, Omics-outcome associations, mediation estimates, and their significance levels using heatmaps.
Data Download:
Allows users to view and download intermediate data, generated results, and a comprehensive object containing all relevant information.
We will give detailed explanations of statistical data analysis and visualization in each step in the Manual session.
Go to TriplotGUI’s git repository. Click the download icon at the right side and download the Exampledata.zip. Unzip it and you will find the data that will be used as example in the tutorial.